Recording HTTP Status Codes
As well as recording the total count of responses sent, we can take this further and extend our metrics() middleware to start tallying exactly which HTTP status codes our responses had.
The tricky part of doing this is finding out what HTTP status code a response has in our metrics() middleware. Unfortunately Go doesn’t make this easy — there is no built-in way to examine a http.ResponseWriter to see what status code is going to be sent to a client.
The de-facto workaround is to create your own custom implementation of http.ResponseWriter which records a copy of the HTTP status code for future access. But doing this can be quite brittle and awkward — there are several edge cases that you need to be wary of, and it can cause problems if you are using any of the ‘additional’ ResponseWriter interfaces such as http.Flusher and http.Hijacker.
Rather than making your own custom http.ResponseWriter implementation, I highly recommend using the third-party httpsnoop package. It’s small and focused, with no additional dependencies, and it makes it very easy to record the HTTP status code and size of each response, along with the total processing time for each request.
If you’re following along, go ahead and download it like so:
$ go get github.com/felixge/httpsnoop@v1.0.2
go: downloading github.com/felixge/httpsnoop v1.0.2
go get: added github.com/felixge/httpsnoop v1.0.2
The key feature of httpsnoop that we’re going to use is the httpsnopp.CaptureMetrics() function, which looks like this:
func CaptureMetrics(hnd http.Handler, w http.ResponseWriter, r *http.Request) Metrics
This function essentially wraps a http.Handler, executes the handler, and then returns a Metrics struct containing the following information:
type Metrics struct {
    // Code is the first http response status code passed to the WriteHeader() method of
    // the ResponseWriter. If no such call is made, a default code of 200 is
    // assumed instead.
    Code int
    // Duration is the time it took to execute the handler.
    Duration time.Duration
    // Written is the number of bytes successfully written by the Write() method of the
    // ResponseWriter. Note that ResponseWriters may also write data to their underlying
    // connection directly, but those writes are not tracked.
    Written int64
}
Let’s dig in and adapt our metrics() middleware to use the httpsnoop package, and record the HTTP status codes for our responses.
To do this, we’re going to publish a new total_responses_sent_by_status variable using the expvar.NewMap() function. This will give us a map in which we can store the different HTTP status codes, along with a running count of responses for each status. Then, for each request, we’ll use the httpsnopp.CaptureMetrics() function to get the HTTP status code, and increment the value in the map accordingly.
While we’re at it, let’s also remove the code that we made earlier for recording the total processing time, and leverage the functionality built in to httpsnoop instead.
Go ahead and update the metrics() middleware as follows:
package main

import (
    "errors"
    "expvar"
    "fmt"
    "net"
    "net/http"
    "strconv" // New import
    "strings"
    "sync"
    "time"

    "greenlight.alexedwards.net/internal/data"
    "greenlight.alexedwards.net/internal/validator"

    "github.com/felixge/httpsnoop" // New import
    "golang.org/x/time/rate"
)

...

func (app *application) metrics(next http.Handler) http.Handler {
    totalRequestsReceived := expvar.NewInt("total_requests_received")
    totalResponsesSent := expvar.NewInt("total_responses_sent")
    totalProcessingTimeMicroseconds := expvar.NewInt("total_processing_time_μs")
    // Declare a new expvar map to hold the count of responses for each HTTP status
    // code.
    totalResponsesSentByStatus := expvar.NewMap("total_responses_sent_by_status")

    return http.HandlerFunc(func(w http.ResponseWriter, r *http.Request) {
        // Increment the requests received count, like before.
        totalRequestsReceived.Add(1)

        // Call the httpsnoop.CaptureMetrics() function, passing in the next handler in
        // the chain along with the existing http.ResponseWriter and http.Request. This
        // returns the metrics struct that we saw above.
        metrics := httpsnoop.CaptureMetrics(next, w, r)

        // Increment the response sent count, like before.
        totalResponsesSent.Add(1)

        // Get the request processing time in microseconds from httpsnoop and increment
        // the cumulative processing time.
        totalProcessingTimeMicroseconds.Add(metrics.Duration.Microseconds())

        // Use the Add() method to increment the count for the given status code by 1.
        // Note that the expvar map is string-keyed, so we need to use the strconv.Itoa()
        // function to convert the status code (which is an integer) to a string.
        totalResponsesSentByStatus.Add(strconv.Itoa(metrics.Code), 1)
    })
}
Alright, let’s try this out. Run the API again, but this time leave the rate limiter enabled. Like so:
$ go run ./cmd/api
{"level":"INFO","time":"2021-04-18T10:09:09Z","message":"database connection pool established"}
{"level":"INFO","time":"2021-04-18T10:09:09Z","message":"starting server","properties":{"addr":":4000","env":"development"}}
Then use hey again to generate some load against the POST /v1/tokens/authentication endpoint. This should result in a small number of successful 201 Created responses, but many more 429 Too Many Requests responses due to the rate limit being hit.
$ BODY='{"email": "alice@example.com", "password": "pa55word"}'
$ hey -d "$BODY" -m "POST" http://localhost:4000/v1/tokens/authentication
Summary:
Total: 0.3351 secs
Slowest: 0.3334 secs
Fastest: 0.0001 secs
Average: 0.0089 secs
Requests/sec: 596.9162
Total data: 7556 bytes
Size/request: 37 bytes
Response time histogram:
0.000 [1] |
0.033 [195] |■■■■■■■■■■■■■■■■■■■■■■■■■■■■■■■■■■■■■■■■
0.067 [0] |
0.100 [0] |
0.133 [0] |
0.167 [0] |
0.200 [0] |
0.233 [0] |
0.267 [0] |
0.300 [0] |
0.333 [4] |■
Latency distribution:
10% in 0.0002 secs
25% in 0.0002 secs
50% in 0.0014 secs
75% in 0.0047 secs
90% in 0.0075 secs
95% in 0.0088 secs
99% in 0.3311 secs
Details (average, fastest, slowest):
DNS+dialup: 0.0008 secs, 0.0001 secs, 0.3334 secs
DNS-lookup: 0.0006 secs, 0.0000 secs, 0.0041 secs
req write: 0.0002 secs, 0.0000 secs, 0.0033 secs
resp wait: 0.0078 secs, 0.0001 secs, 0.3291 secs
resp read: 0.0000 secs, 0.0000 secs, 0.0015 secs
Status code distribution:
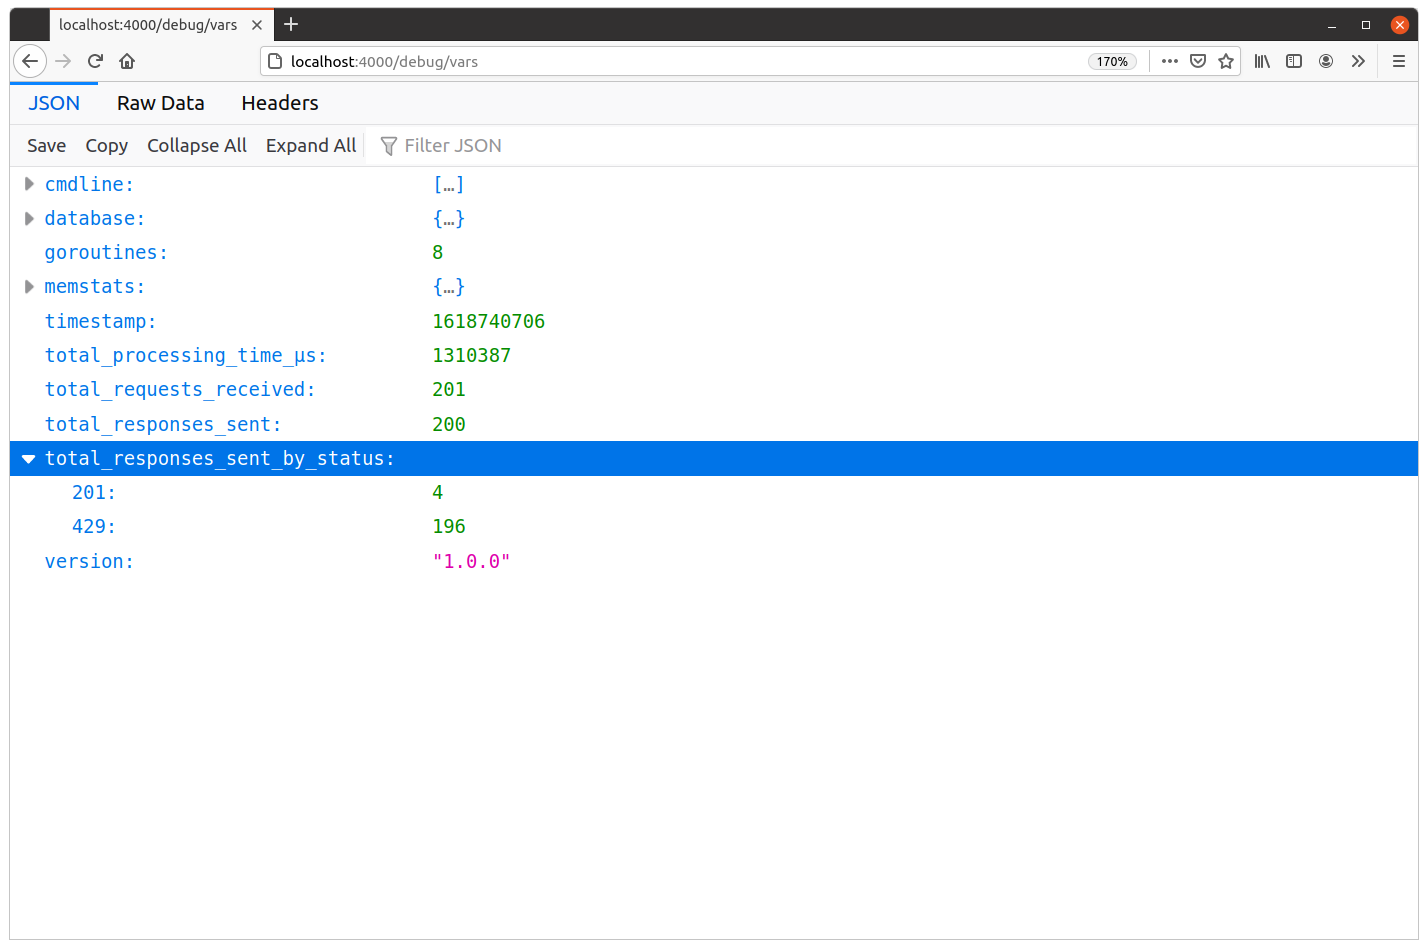
[201] 4 responses
[429] 196 responses
And if you take a look at the metrics in your browser, you should now see the same corresponding counts for each status code under the total_responses_sent_by_status item, similar to this:
Additional Information
Visualizing and analyzing metrics
Now that we have some good application-level metrics being recorded, there is the whole question of what should you do with them?
The answer to this will be different from project-to-project.
For some low-value applications, it might be sufficient to manually spot check the metrics every so often — or only when you suspect a problem — and make sure that nothing looks unusual or out of place.
In other projects, you might want to write a script to periodically fetch the JSON data from the GET /debug/vars endpoint and carry out further analysis. This might include functionality to alert you if something appears to be abnormal.
At the other end of the spectrum, you might want to use a tool like Prometheus to fetch and visualize the data from the endpoint, and display graphs of the metrics in real-time.
There are a lot of different options, and the right thing to do really depends on the needs of your project and business. But in all cases, using the expvar package to collect and publish the metrics gives you a great platform from which you can integrate any external monitoring, alerting or visualization tools.